


I expected my preparation for the Agents of SigNoz Hackathon by WeMakeDevs to begin with an AI idea.
Instead, it began with an empty SigNoz screen.
I had heard the observability vocabulary before: logs, metrics, traces, dashboards, alerts, and OpenTelemetry. But I had never used those signals together while a system was actually failing. I could read a definition of distributed tracing, but I could not answer a practical question like: checkout is slow; how do I prove whether payment, inventory, the database, or an asynchronous consumer is responsible?
Rather than jump straight into a competition project, I built a smaller learning lab called ObserveAI. Its purpose was simple: create a system that can fail in controlled ways, send its telemetry to self-hosted SigNoz, and learn how to investigate with evidence.
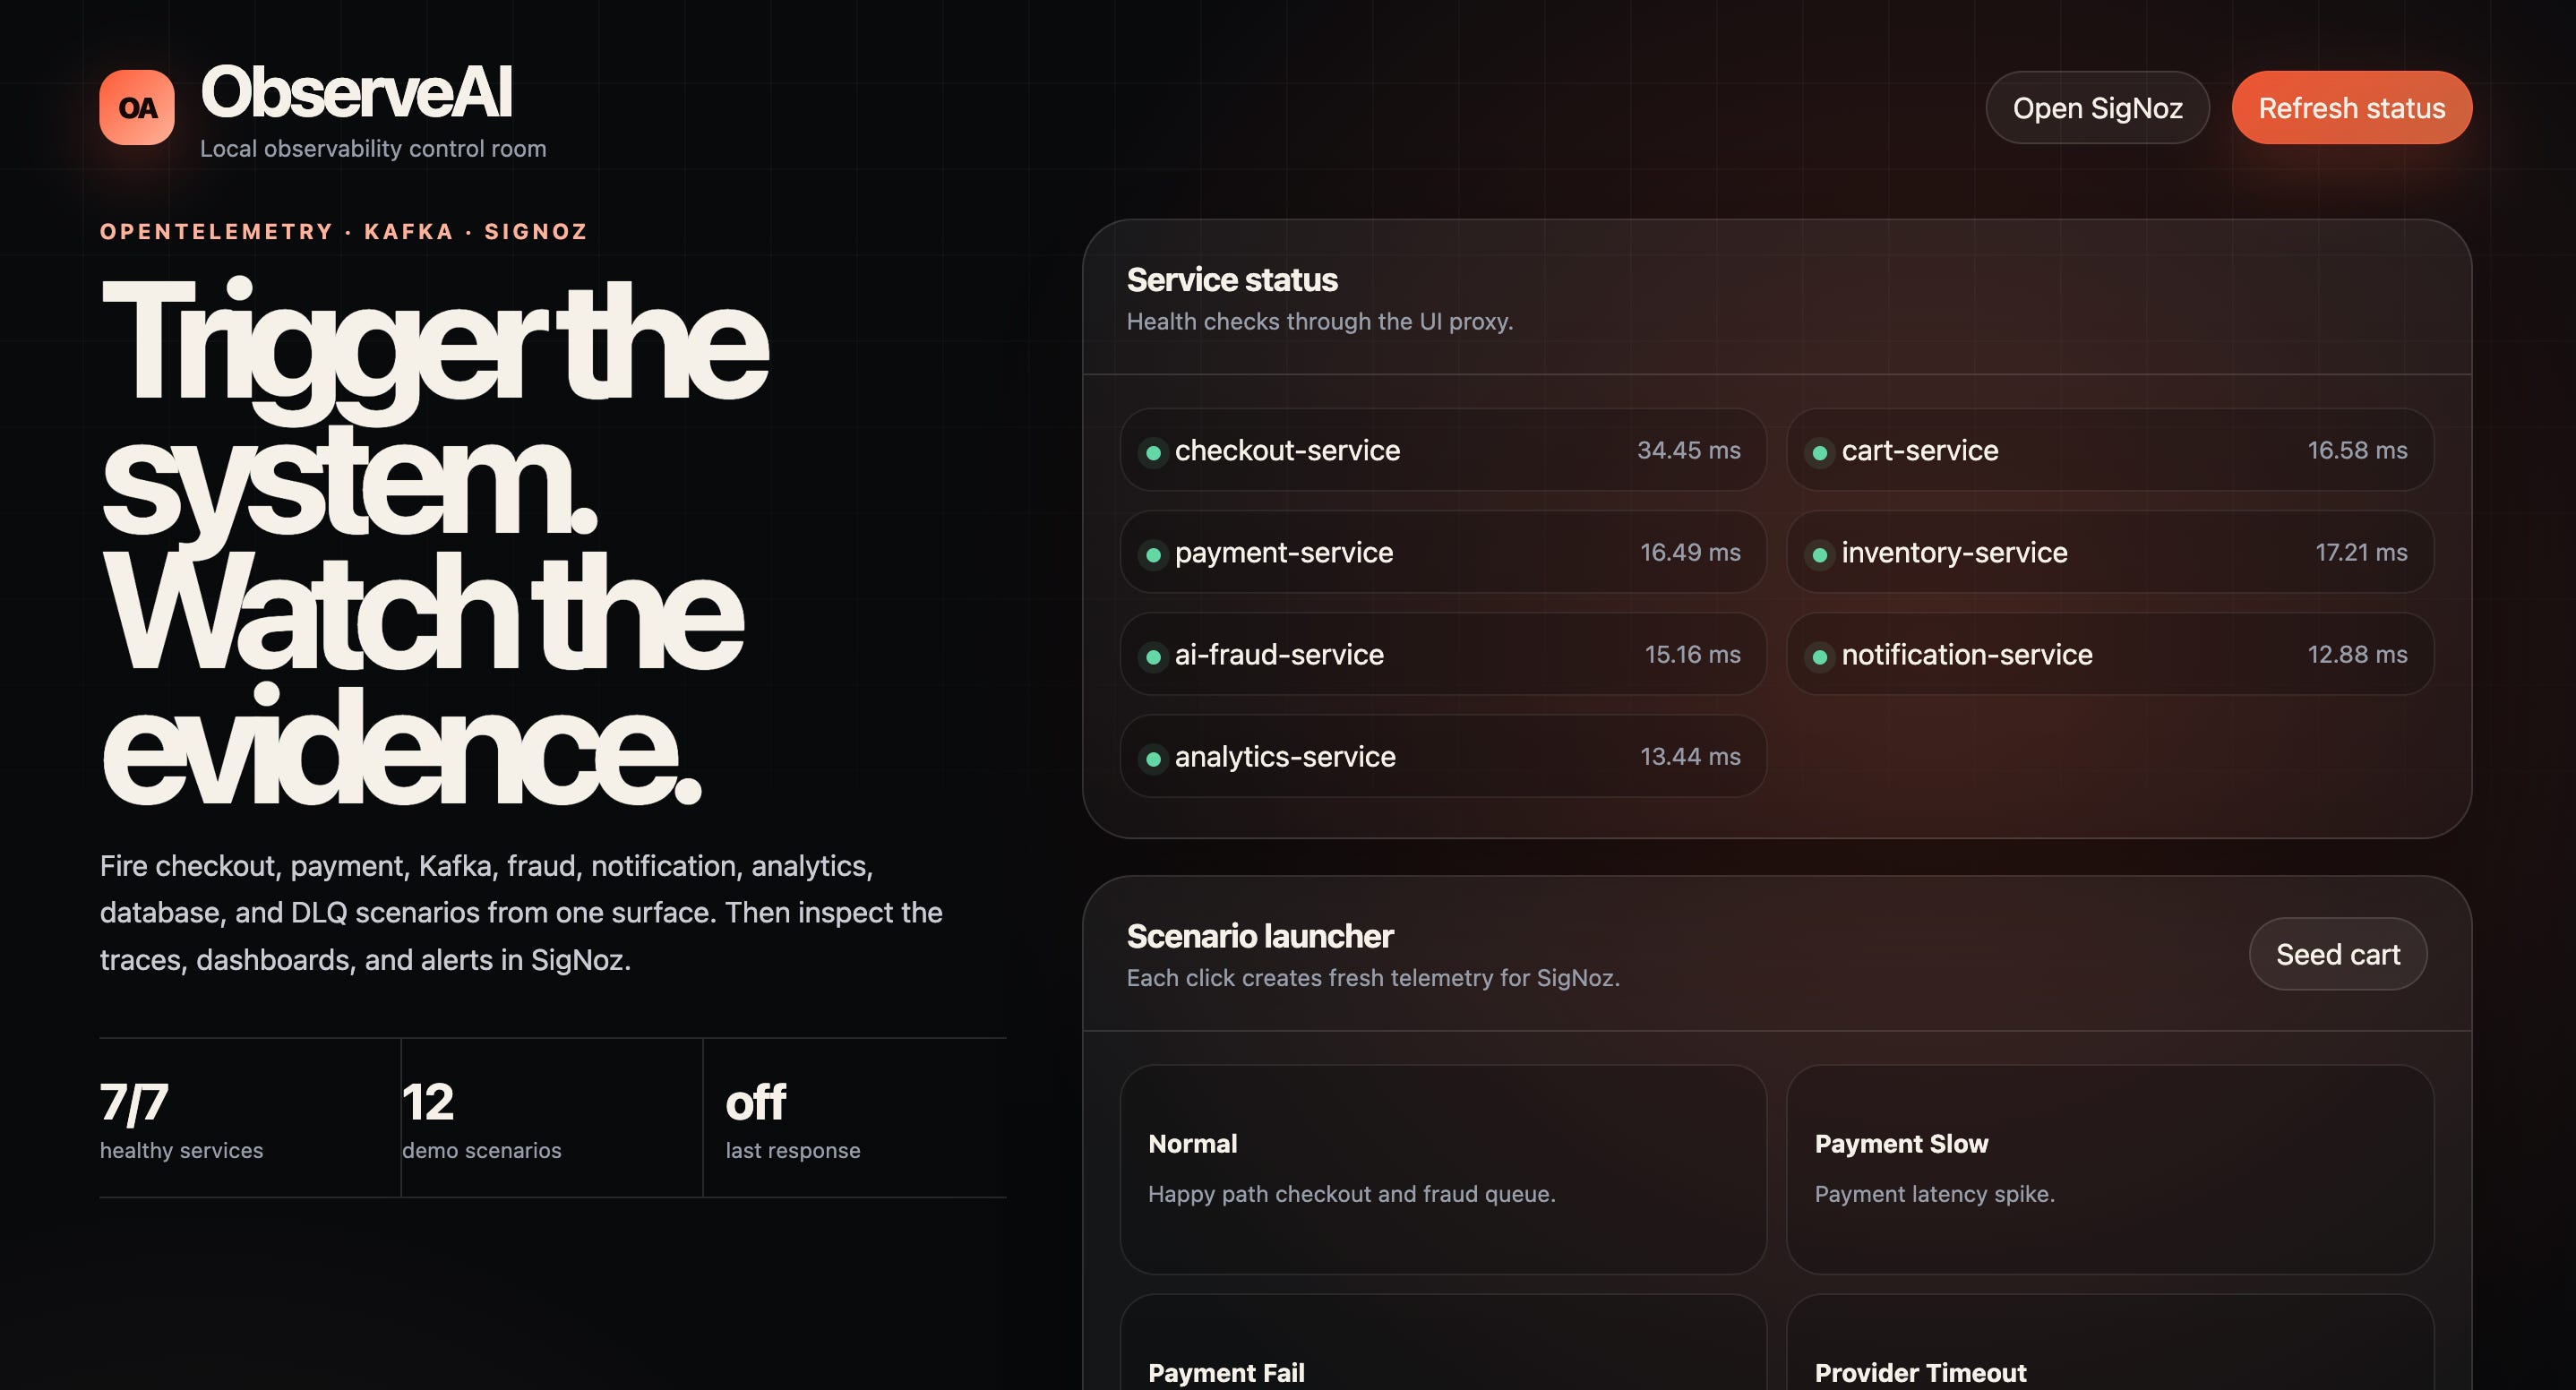
This post is the story of what finally made observability click for me: the difference between a running app and an app that can explain itself.
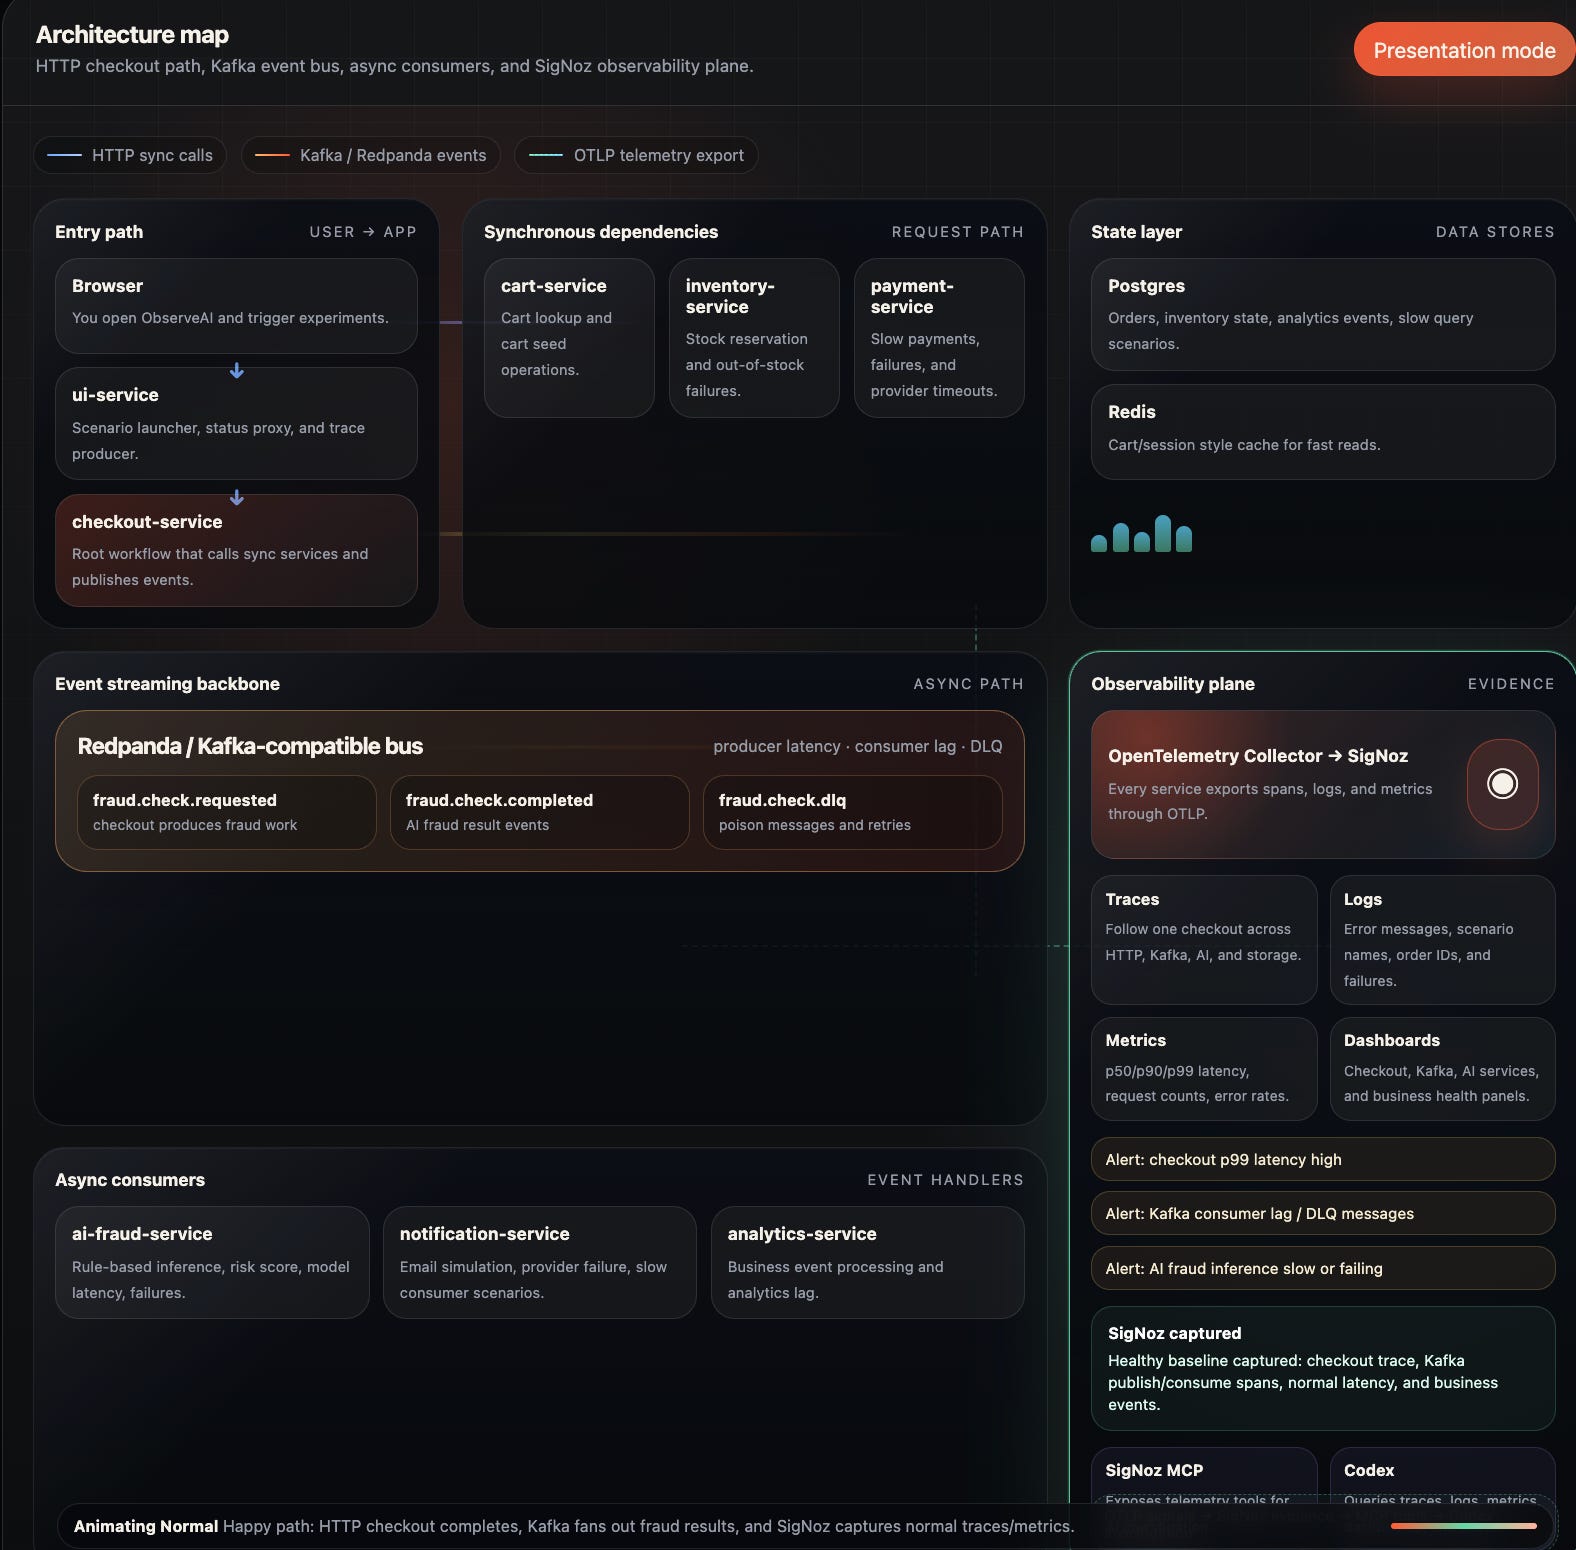
I built a checkout flow on purpose
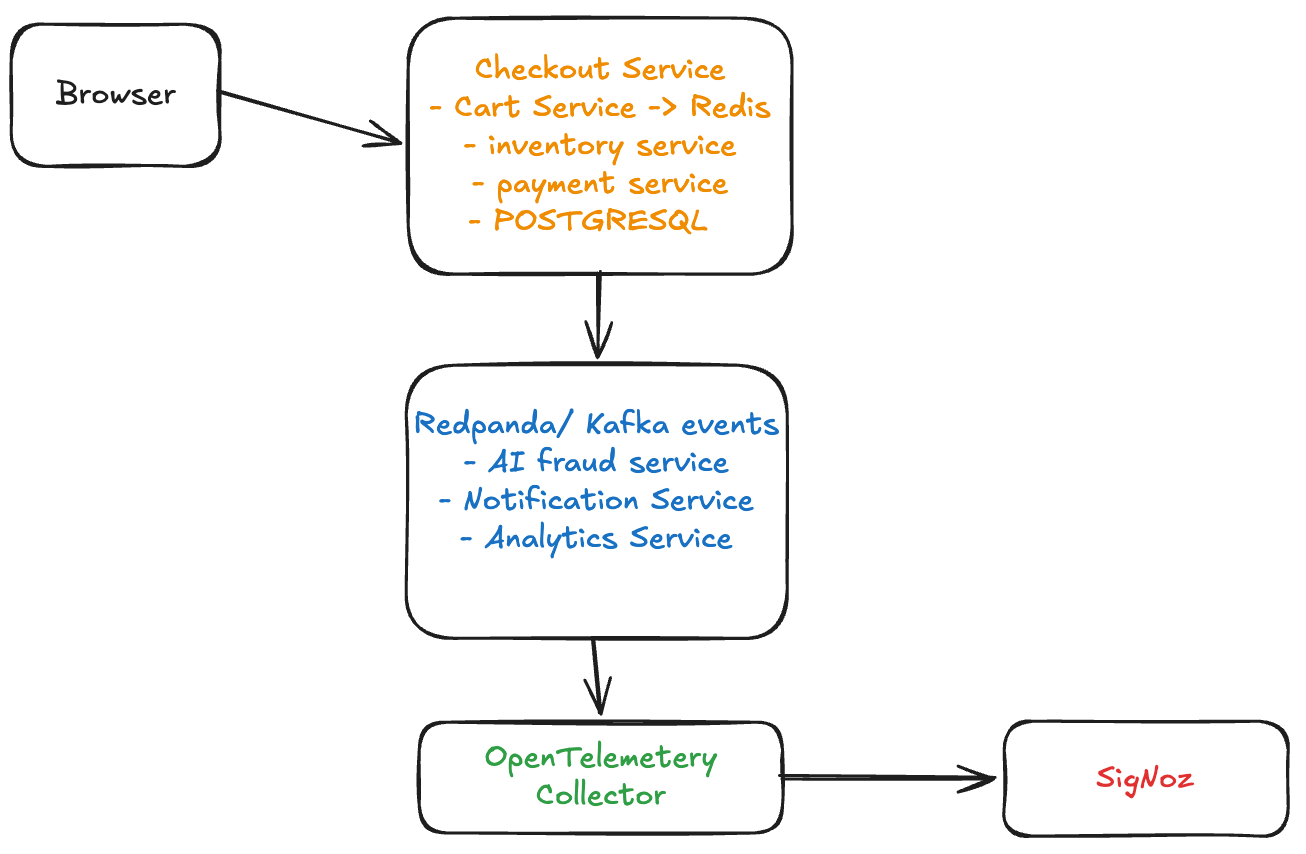
I chose a small e-commerce checkout flow because the failures are intuitive. A customer places an order, inventory is reserved, payment is processed, an order is written, and follow-up work happens asynchronously.
ObserveAI contains:
FastAPI services for checkout, cart, inventory, payment, notifications, and analytics
Redis for cart-style state and PostgreSQL for order-related data
Redpanda, a Kafka-compatible event bus, for fraud, notification, and analytics events
a small rules-based ai-fraud-service
an OpenTelemetry Collector and a self-hosted SigNoz instance
a traffic generator that keeps live signals flowing
The request path looks like this:
I deliberately added failure scenarios: payment_slow, provider_timeout, inventory_fail, fraud_ai_slow, kafka_consumer_slow, and poison_message. They make the system useful for learning because I can change one behaviour and observe what changes in the telemetry.
The first lesson: an observability stack can run and still observe nothing
My first setup looked healthy from the terminal. The services were up, the collector was up, and SigNoz was up. But there was no data in the SigNoz UI.
This was the first thing I learned that I would not have understood from reading definitions: observability starts with data delivery, not dashboards.
My app containers sent OTLP to the local collector, but that collector also needed a route to the SigNoz ingestion endpoint from inside Docker. The useful configuration in my setup is short:
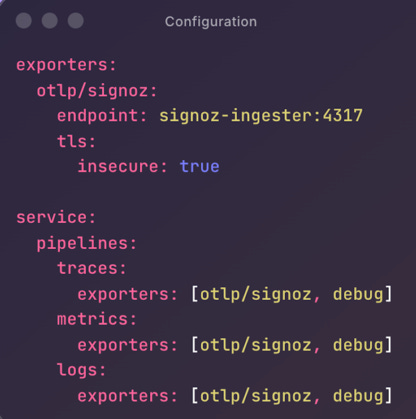
The collector joins the SigNoz Docker network, so signoz-ingester: 4317 is reachable from the collector. Once I corrected that connection and generated requests, services such as checkout-service, payment-service, inventory-service, and ai-fraud-service began appearing in SigNoz.
That was a much more satisfying milestone than a polished dashboard. Until then, I had an application. After that, I had an application that could expose evidence about its own behaviour.
For anyone reproducing this locally: SigNoz’s current self-hosted Docker guide uses Foundry and lists 8080 for the Ul plus 4317 and 4318 for OTLP ingestion. I kept ObserveAl’s own web ports separate so those ports could remain available to SigNoz. SigNoz’s Docker installation guide is the source I followed.
Continuous traffic made the data meaningful
I then made one design choice that changed the project: I added a traffic generator.
Without it, I would submit one checkout, inspect one trace, and wait.
With generated normal checkouts and controlled failures, SigNoz started showing changes over time. A provider timeout caused error spans and error logs. A slow payment moved the latency distribution. A slow Kafka consumer created an async backlog while the original checkout could still return success.
The project can be started with the same commands I used:
cp .env.example .env
docker compose up --build
Then I use the smoke test to seed normal traffic and several controlled failure paths:
bash tests/smoke_test.sh
For a run with latency spikes, expected failures, Kafka activity, and fraud-service spans:
bash tests/big_smoke_test.sh
The important lesson was not the script itself. It was seeing that one failed request is an event, while a pattern over time is a signal.
The SigNoz feature that finally made sense: traces
Distributed tracing was the SigNoz feature that changed my mental model most.
Before ObserveAl, I thought of logs as the main debugging tool. Logs tell you that something happened, but a log from payment-service does not automatically show how the request reached payment-service or what happened before it.
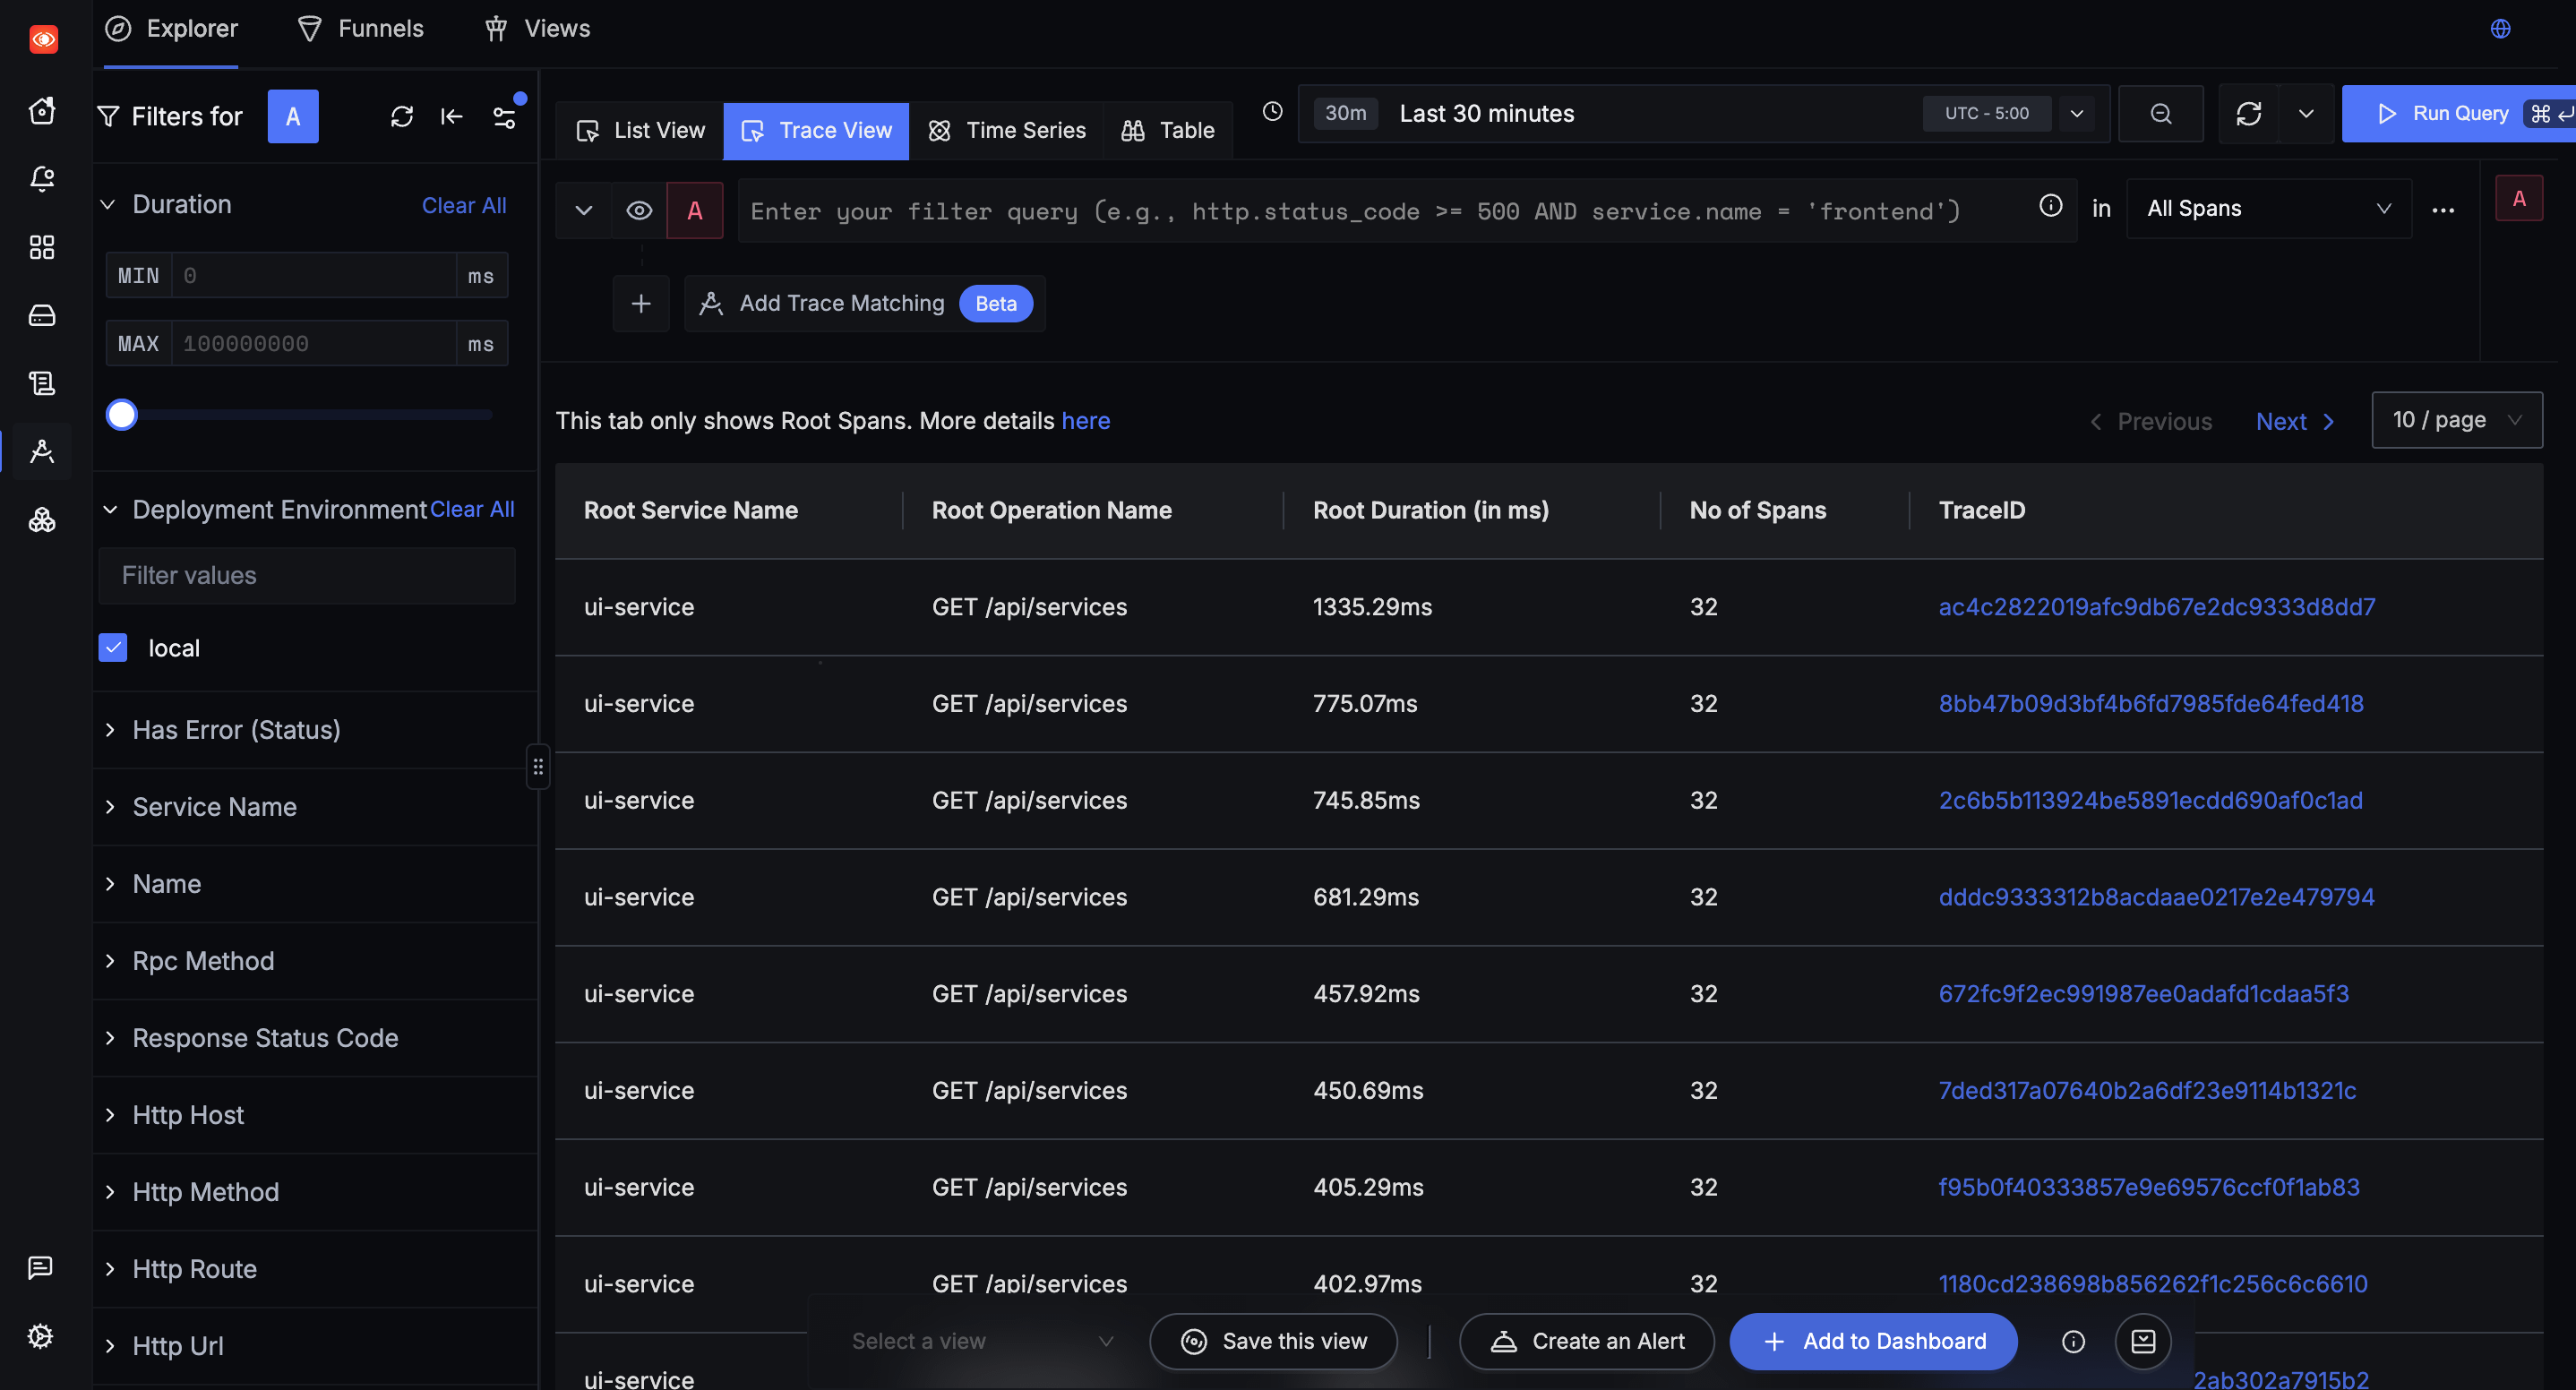
When I triggered payment slow, I could see the payment span take most of the checkout time.
When I triggered db slow, the slow database step became visible. This is much stronger than saying “checkout is slow.” I could point to the place where the time went.
The Kafka scenarios added another useful twist. With poison message, checkout could succeed while the fraud consumer retried and pushed the event toward a dead-letter path. That taught me that a successful HTTP response does not always mean the entire workflow is healthy. Observability has to follow the asynchronous work as well.
How logs and metrics completed the investigation
The traces became even more useful because ObserveAI’s logs include context such as the service, scenario, order ID, trace ID, and span ID:
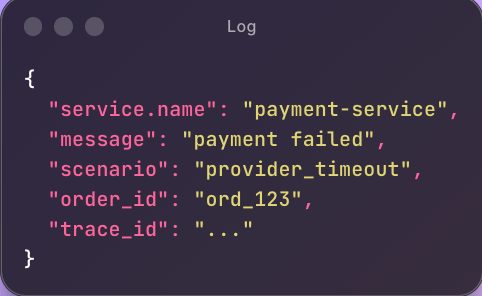
For me, this is where logs stopped being random text. An error message can point to a trace, and the trace can show the downstream path and timing. The telemetry becomes one investigation rather than three separate tools.
Metrics tell me when to start that investigation. p50, p90, and p99 became clear only after I caused failures:
p50 = the typical request experience
p90 = the slower end of requests
p99 = the slowest 1% of requests
If average latency looks fine but p99 rises, some users can still be having a bad experience. In ObserveAI, slow payments and provider timeouts were a simple way to see that tail latency matters.
My practical investigation flow is now:
Metrics → Is something changing?
Traces → Where is the time or failure?
Logs → What exact context supports the explanation?
This is the most useful thing I learned from the project.
Dashboards, alerts, and MCP
After I had usable traces, logs, and metrics, dashboards and alerts became easier to think about. I created queries around checkout latency, payment failures, fraud latency, Kafka consumer lag, dead-letter events, and database slowness.
The distinction I keep coming back to is:
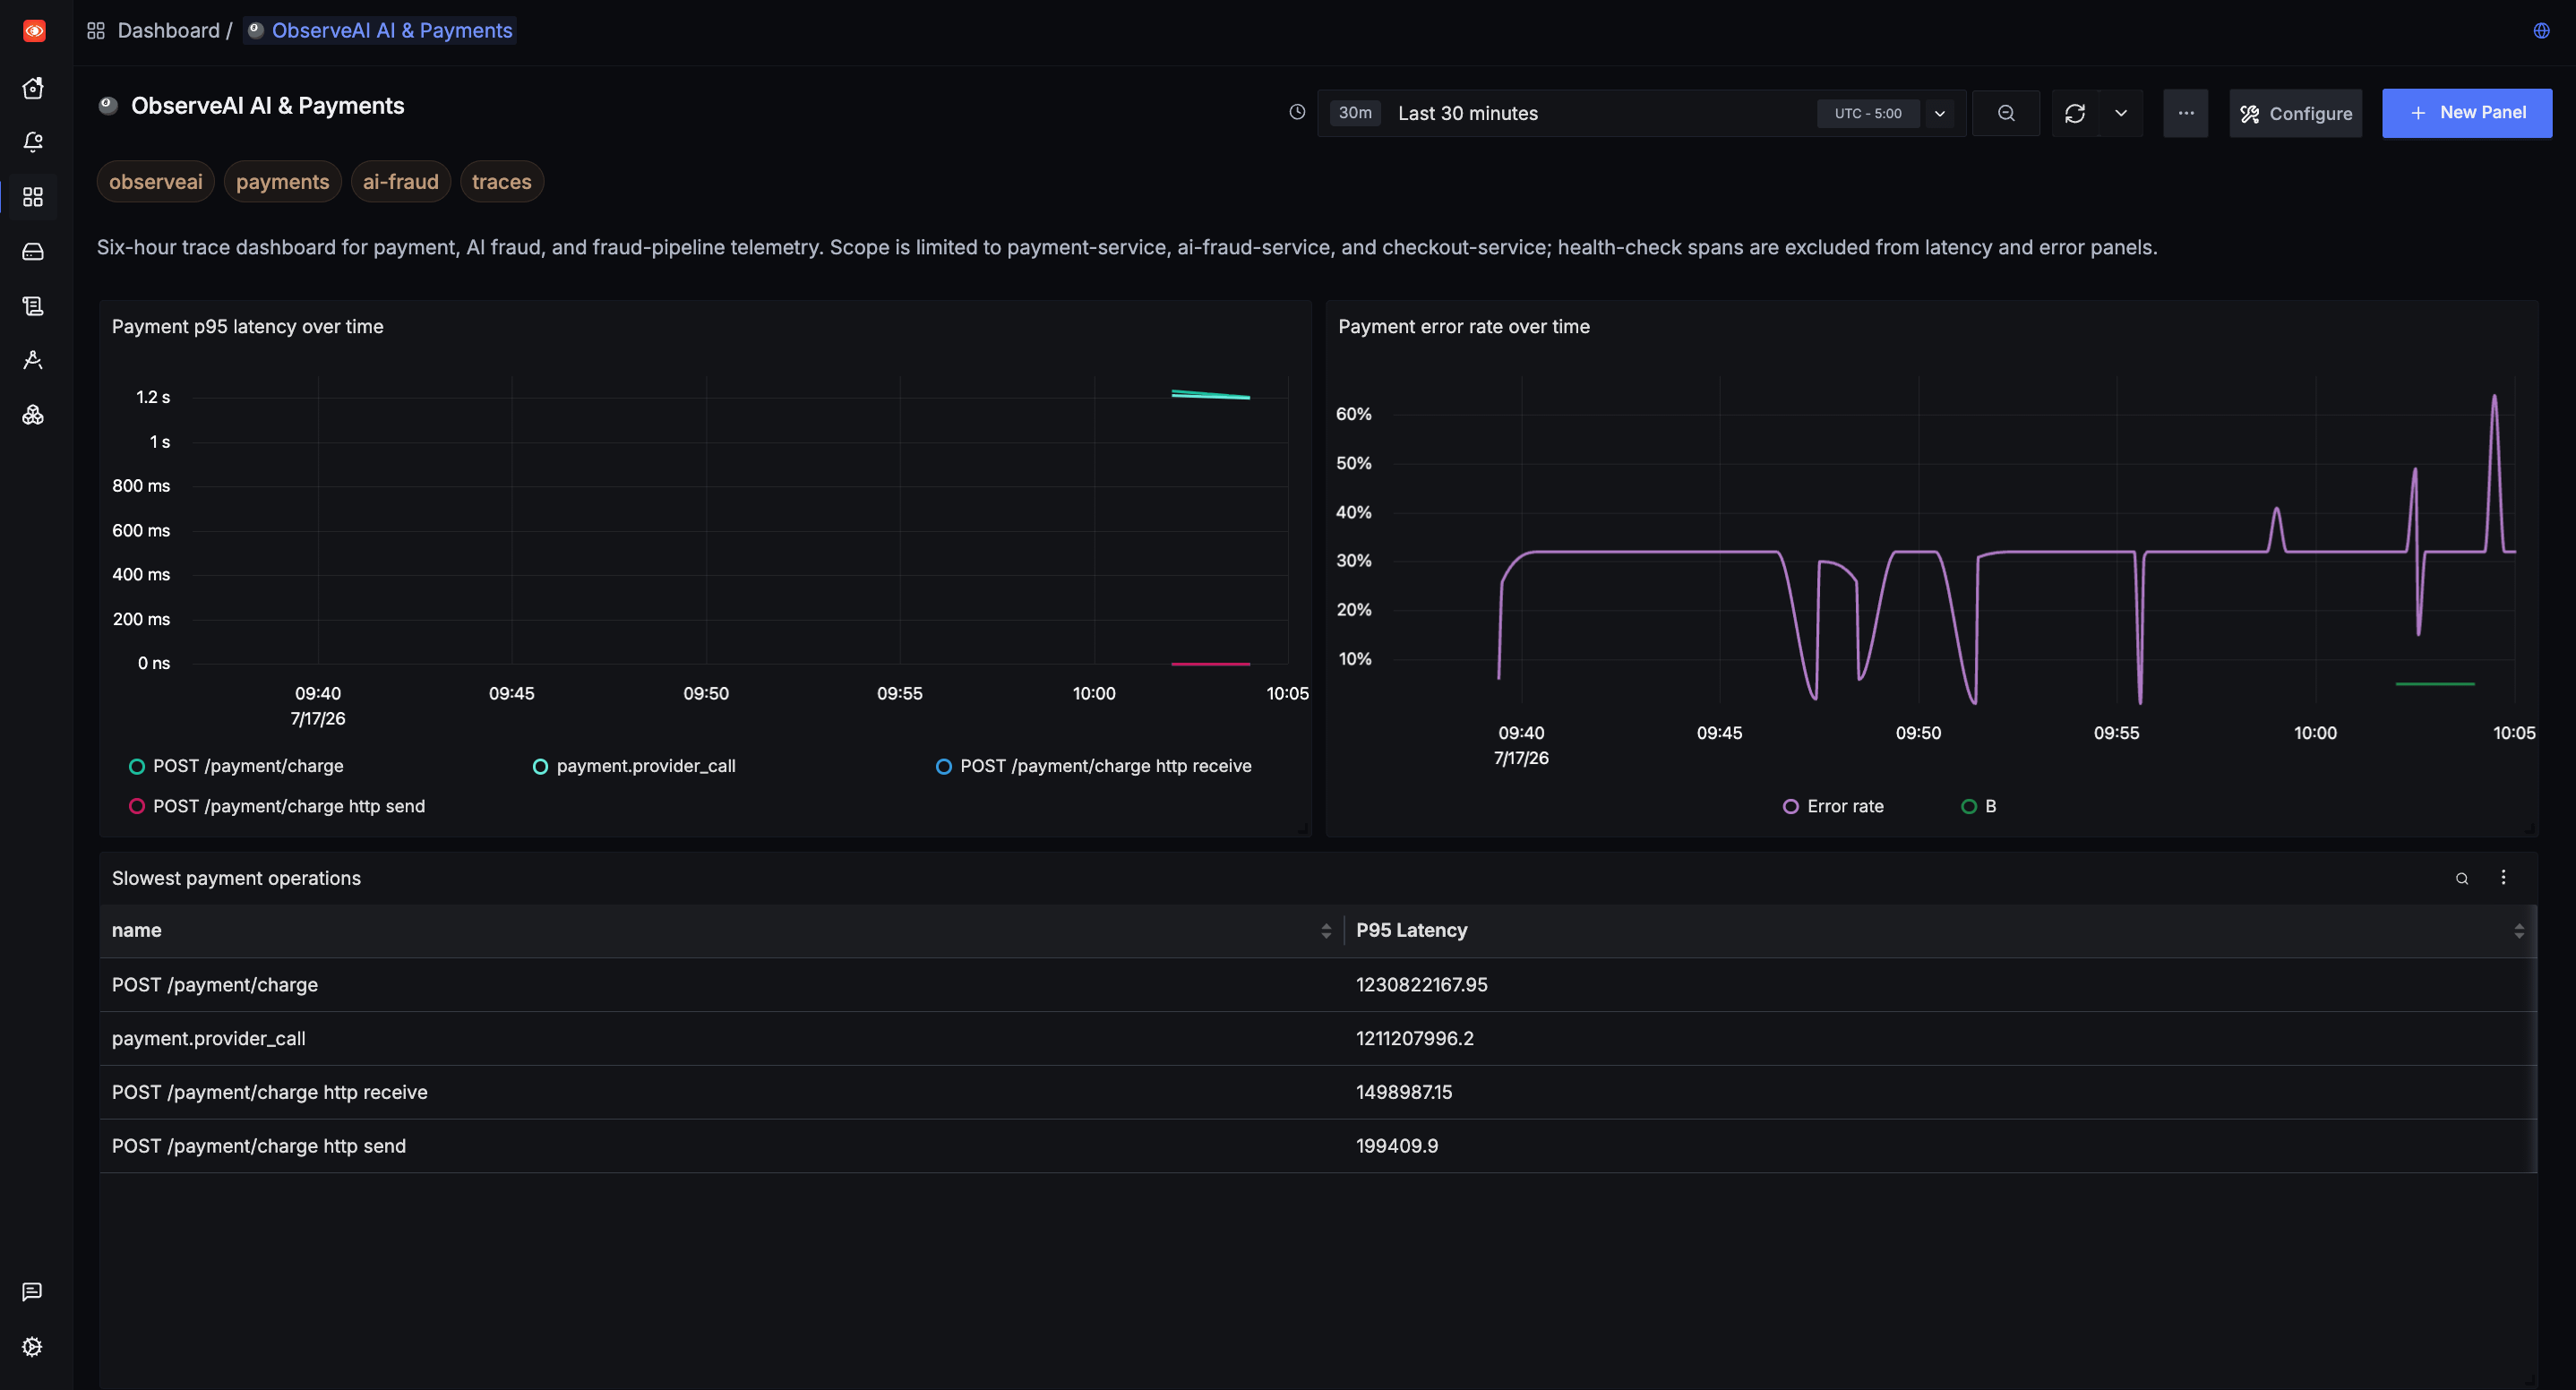
Dashboards are for seeing. Alerts are for acting.
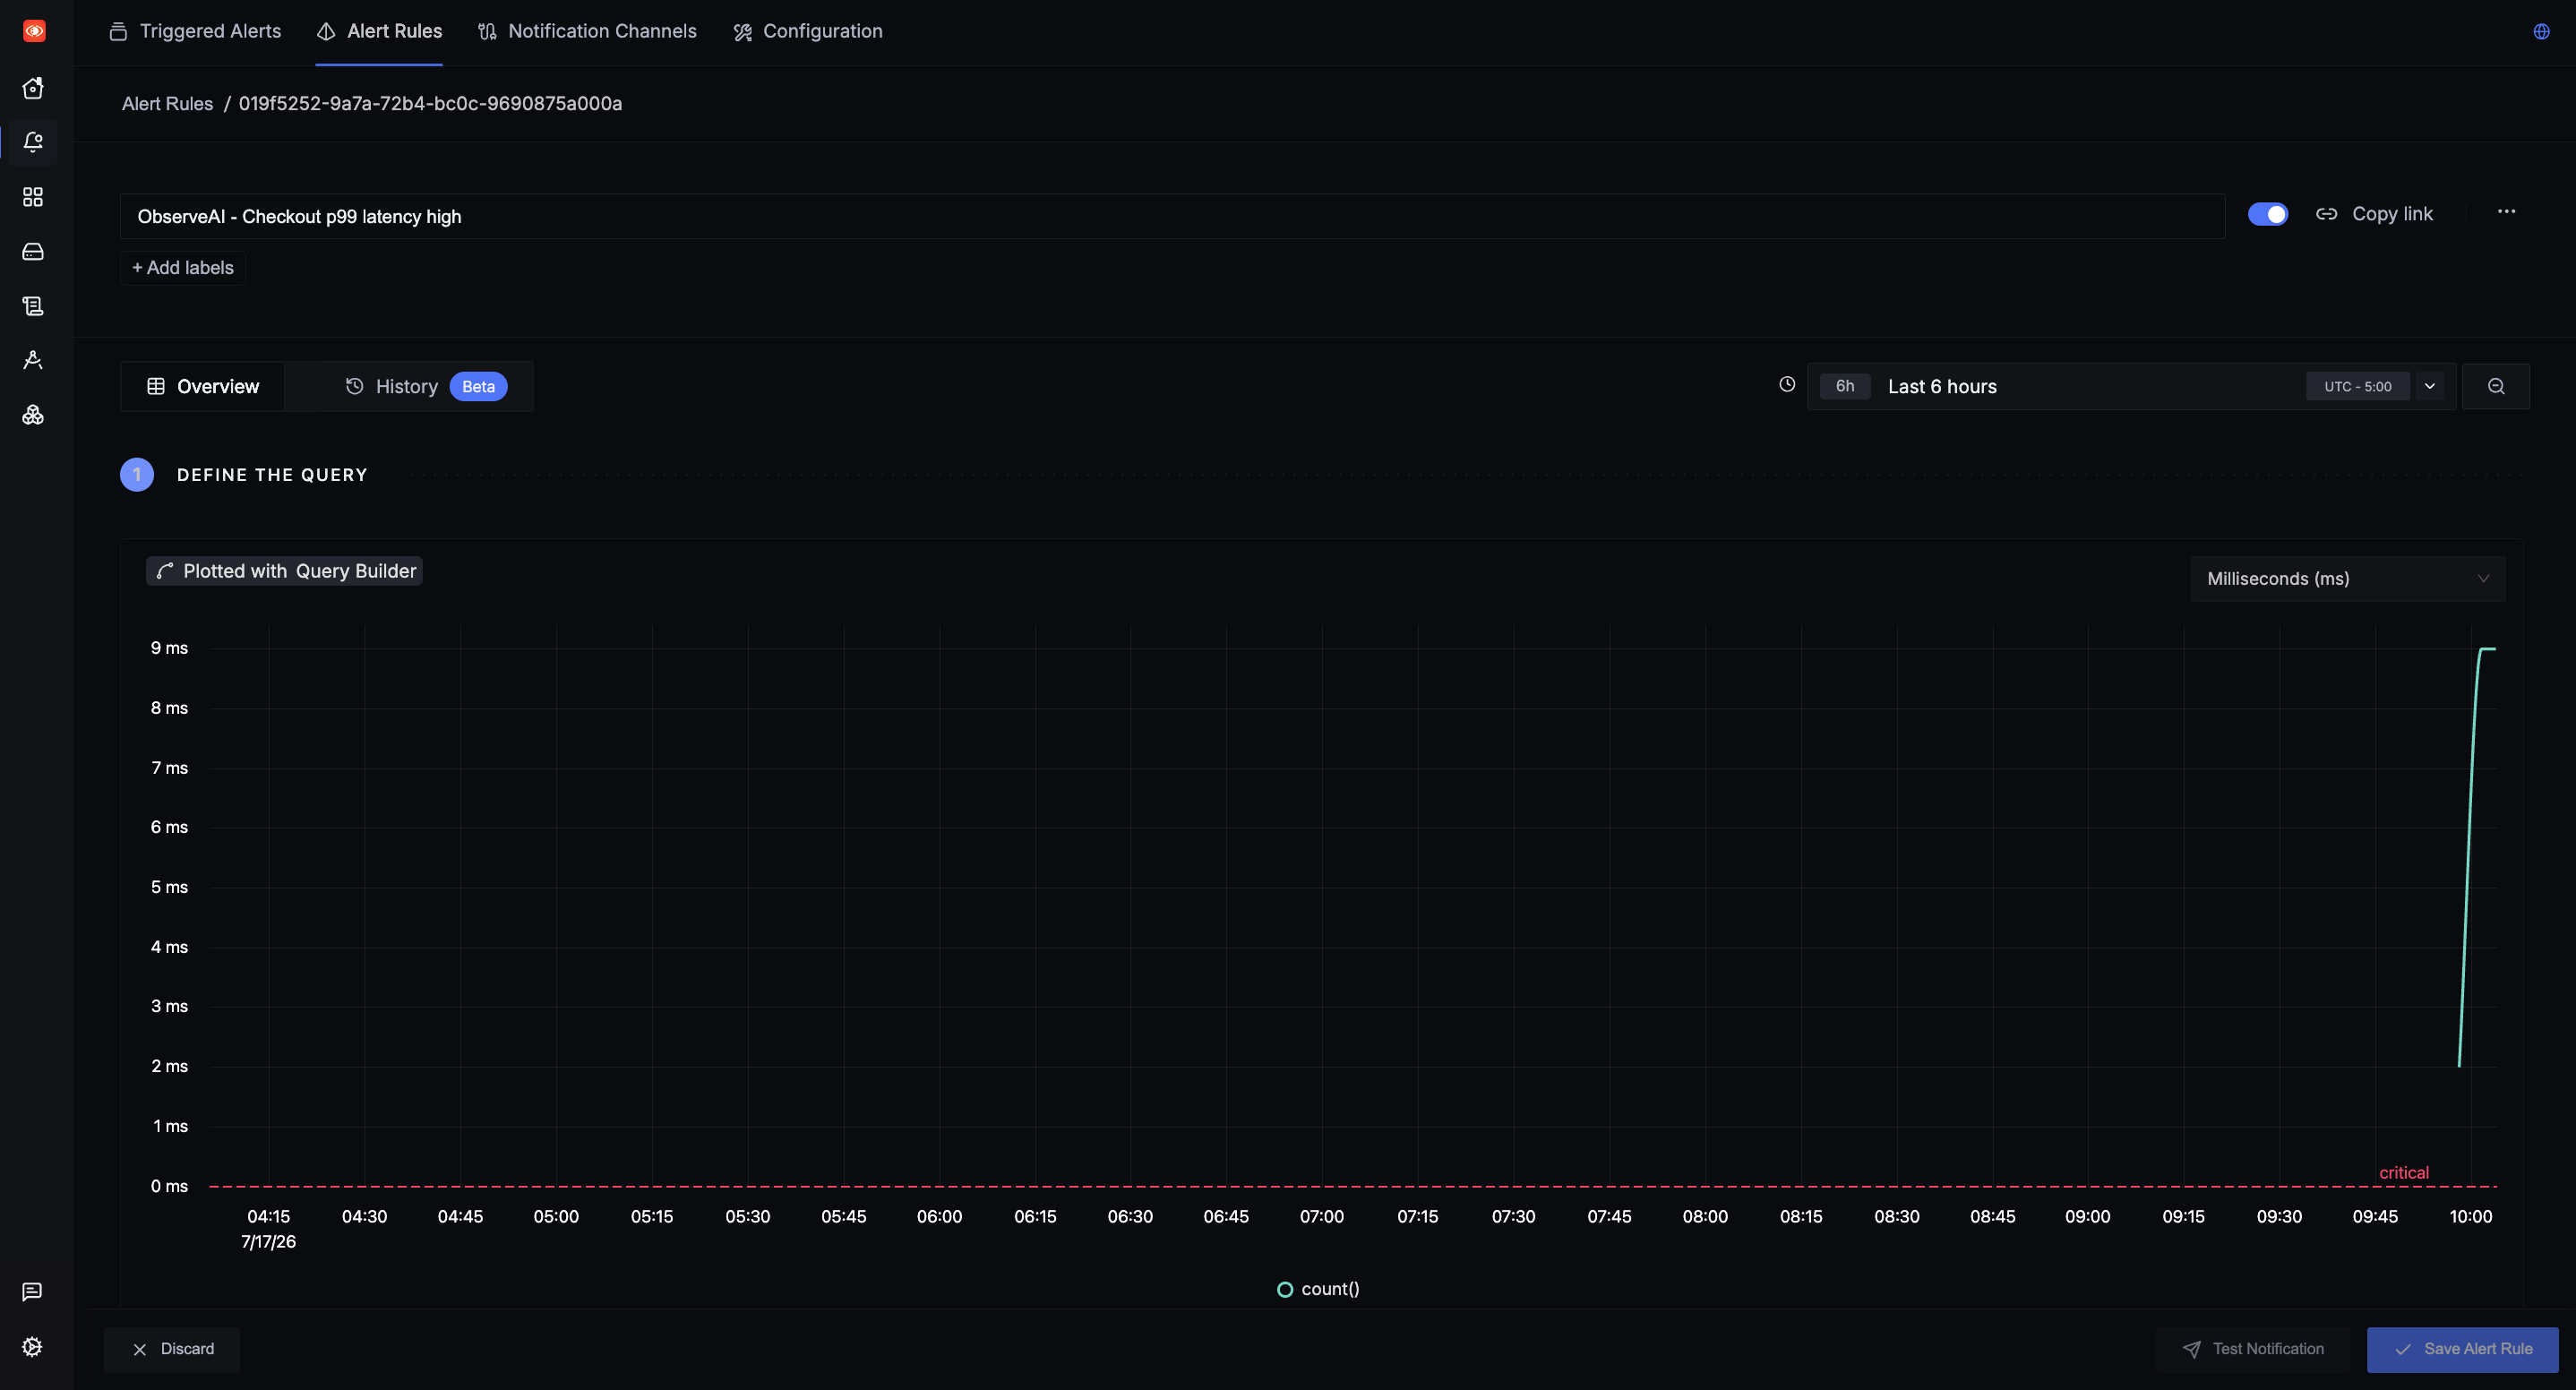
A dashboard helps me explore whether payment latency is climbing. An alert should be tied to a condition that deserves action: sustained checkout latency, an elevated payment error rate, growing consumer lag, or dead-letter events. Making an alert for every number would only create noise.
I also connected SigNoz MCP to Codex after telemetry was available. Asking an AI client to query the running service list or inspect signals felt different from asking a generic chatbot, because the answer could begin with the evidence in SigNoz. The key insight for me was simple: an assistant investigating an incident should query telemetry first, then explain what it found.


What I would tell my past self
Do not start by designing a dashboard.
Start with one request path, one controlled failure, and a way to verify that your telemetry reaches the backend. Then use metrics to notice the change, traces to find the path, and logs to confirm the context.
That sequence made observability feel much less abstract to me.
I started this project to prepare for a hackathon. I ended it with real traces and signals in SigNoz, and a much clearer understanding of observability: not collecting more data, but reducing guesswork when a system behaves unexpectedly.
Links and notes
- ObserveAI repository: Github Repo
- SigNoz self-hosted Docker / Foundry guide
- OpenTelemetry Python instrumentation documentation
AI assistance disclosure
I used AI assistance (Codex with GPT 5.6 Terra and Luna) as a coding and editing collaborator while building and writing about ObserveAI. The local setup, debugging, testing, screenshots, and conclusions described here come from my own hands-on work.